Welcome to UCSF's Risk Stratification Tool for Tuberculosis Clinical Trial Design!
This evidence-based interactive tool uses a validated model and risk stratification algorithm to stratify patients with tuberculosis (TB) into risk groups and inform selection of optimal treatment durations for each risk group to test in late-stage TB clinical trials. Our tool can be used by researchers and clinical trialists to inform a priori decisions regarding optimal durations for new TB regimens being considered for phase 3 clinical trials and to design novel phase 3 clinical trials that account for major risk factors. We provide a clinical trial design resource that can inform decisions that facilitate early and effective deployment of the best regimens for the right patients.
The Risk Stratification Module uses available information on patient characteristics to assign risk groups and predict optimal treatment durations for the subgroup of interest.
The Clinical Trial Design Module performs model simulations that can inform optimal treatment durations to test in clinical trials based on the study design (e.g. one-size-fits-all, subgroup analysis, enrichment, or risk stratification study designs).

Frequently Asked Questions
Who is the tool for?
This tool uses information routinely and readily collected in contemporary clinical trials that evaluate TB regimens and is intended for researchers and clinical trialists as a resource for designing late-stage TB clinical trials. It can be used to stratify patients into risk groups of unfavorable outcome, inform a priori decisions regarding optimal durations for new regimens being considered for phase 3 clinical trials and to design novel phase 3 clinical trials that account for major risk factors (e.g. enrichment or risk stratification studies). The tool is not intended for programmatic use at this time, though it could be in the future as additional data emerging from contemporary phase 3 clinical trials is incorporated into the model and risk stratification algorithm.
What data was used to develop and validate the tool?
Individual-level data (N=3405) from three international, randomized phase 3 trials (OFLOTUB, NCT00216385; REMoxTB, NCT00864383; RIFAQUIN, ISRCTN44153044) that compared 4-month standard-dose rifamycin regimens with a fluoroquinolone to the standard 6-month regimen for treatment of drug-susceptible TB were pooled and used for model development. A fourth trial (DMID 01-009, NCT00130247, N=386) was used as an independent dataset for external validation, which tested a 4-month standard regimen (no fluoroquinolone) in a subpopulation of drug-susceptible TB patients with non-cavitary disease and month 2 culture conversion. For each of these regimens, rifampin was administered at the standard dose of 10 mg/kg for the complete duration of the regimen or rifampin was administered at the standard dose during the intensive phase and then replaced by rifapentine at 900 mg twice weekly in the continuation phase of treatment (4-month regimen in RIFAQUIN study). The individual-level data was obtained from TB-PACTS and data acquisition and sharing was coordinated by the Critical Path to TB Drug Regimens (CPTR). Additional information on study design for these trials are available in the original publications.
What data inputs are required?
Risk Stratification Module: The user is required to select patient characteristics (HIV status, sex, BMI, baseline smear grade, and baseline cavitary disease status (absent or present), and month 2 culture status) for a subgroup of interest to calculate a risk score based on exact regression coefficients of risk factors in the final model that predicts unfavorable outcomes. A target cure rate is also required and used in conjunction with the calculated risk score to predict optimal treatment duration for the selected subgroup of interest. The optimal treatment duration is then used to assign a risk group: low, ≤18 weeks; moderate, 19-24 weeks; high, >24 weeks. The user can specify when a patient characteristic is missing. This module handles missing data by bootstrapping 500 participants from the subset of the pooled population from the original studies with the same available risk factors (see How is missing data handled?).
Clinical Trial Design Module: Model simulations are performed to assess the proportion of cured patients following 8 to 36 weeks of treatment with a standard-dose rifamycin-containing regimen in a one-size-fits-all, subgroup analysis, enrichment, or risk stratification study design. The user is first required to select a study design (one-size-fits-all, subgroup analysis, enrichment, risk stratification) for simulations. The user will then select the adherence pattern for the population (100% for all patients or pragmatic adherence), target cure rate, and patient characteristics of the population to include in simulations. Prompts for patient settings will depend on the study design selected:
What efficacy outcome was modeled and how is the target cure rate defined?
The primary efficacy outcome was not standardized among the pooled studies. Each study used its own composite definition of unfavorable outcome that included TB-related (failures, relapse, recurrence, TB-related deaths) and non-TB related (dropouts, adverse events, withdrawal, inadequate treatment, etc.) outcomes. To alleviate this issue, we developed two separate models for: i.) time to TB-related outcomes and ii.) time to non-TB-related outcomes. This approach allowed for evaluation of dichotomy between TB-related and non-TB-related outcomes, such that we would not expect common TB predictors (e.g. disease burden and severity) to be associated with non-TB-related outcome if they are not related to TB. Indeed, regimen and disease specific risk factors only predicted TB-related outcomes but did not predict non-TB-related outcomes. Therefore, the risk stratification algorithm is solely based on the TB-related outcome model and the proposed optimal treatment durations would only benefit TB-related outcomes. The target cure rate is defined as the target proportion of patients who do not have a TB-related outcome (proportion cured) at 18 months after the start of treatment.
What are the main assumptions for the tool?
The assumptions associated with the use of our tool are:
How was the model and risk stratification algorithm developed?
Full details on model and risk stratification algorithm development and validation is available in our peer-reviewed publication. A parametric time-to-event model was used to describe time to TB-related outcomes (failures, relapse, recurrence, TB-related deaths). Non-TB-related outcomes (dropouts, adverse events, withdrawal, inadequate treatment, etc.) were also modeled separately, but older age was the only risk factor of non-TB-related outcomes, so derivation of the risk stratification algorithm was based solely on the final model for TB-related outcomes. Exact regression coefficients for significant baseline (HIV status, sex, BMI, smear grade, cavitary disease status (absent or present)) and on-treatment (month 2 culture status) predictors of TB-related outcomes in the final model were used to derive a risk score for each individual, Risk Scorei, with the following formula:
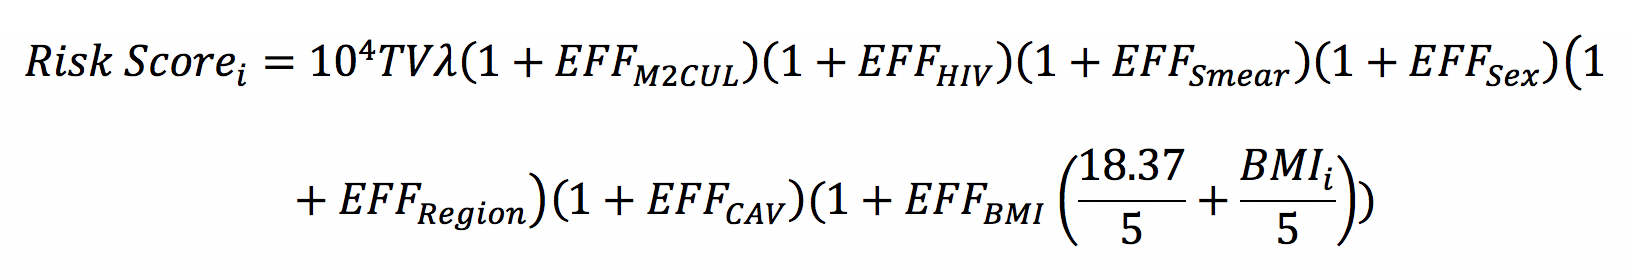
where TVλ (=10-4.1) is the model-estimated population (median) baseline hazard risk, 104 is a scaling factor, BMIi is the individual’s BMI, and EFFz are exact regression coefficients that describe the fractional increases in baseline hazard risk according to the individual’s risk factors:

The risk scores and the final model for time to TB-related outcomes were used to calculate the optimal treatment duration for each individual, TRTDURATIONi, required to reach a specified target cure rate, CUREtarget, using the following formula:
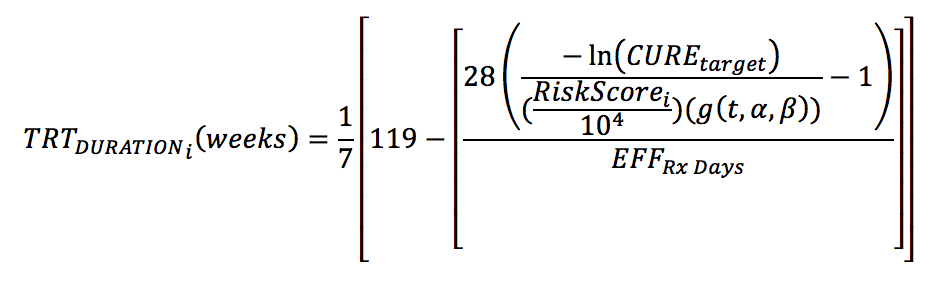
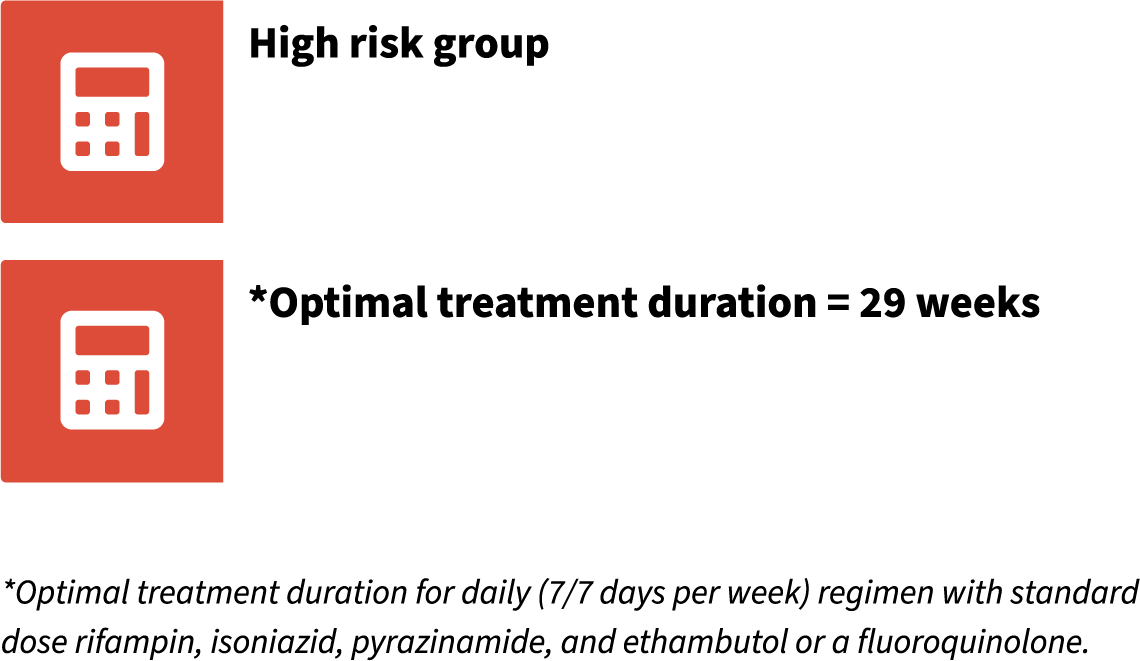
where g(t,α,β) is a function independent of an individual's risk factors and dependent on time (t = 18 months) and survival shape parameters (α and β) (see our peer-reviewed publication for additional details). This formula is for a standard-dose rifamycin-containing regimen administered 7/7 days per week. In the Risk Stratification Module, the optimal treatment duration is used to assign individuals into risk groups. Patients with optimal treatment duration of ≤18 weeks to reach the specified target cure rate is assigned to the low risk group; 19 to 24 weeks to the moderate risk group; and >24 weeks to the high risk group.
How is missing data handled?
Risk Stratification Module: Missing data on patient characteristics is handled by bootstrapping (with replacement) 500 participants from a subset of the pooled population from the original studies with the same available risk factors. The median risk score of the bootstrapped population is used to assign risk groups and predict optimal treatment duration. If all patient characteristics are missing, then the reported risk group and optimal treatment duration are for the average patient in the pooled population.
Clinical Trial Design Module: The subgroup analysis study design can handle missing data on patient characteristics. It is handled by bootstrapping (with replacement) 500 populations from the subset of the pooled population from the original studies with the same available risk factors and using the bootstrapped populations for model simulations. The sample size of each bootstrap population is the size of the subset of the pooled population with the same available risk factors. Each bootstrapped population will have a distribution of the missing patient characteristic that is approximately the distribution observed in the original studies. For example, if cavitary disease status is missing, the subset of the pooled population with the same available risk factors are used to bootstrap populations for model simulations and approximately 60-70% of patients in each bootstrap population will have cavitary disease The exact proportion will depend on available information of other risk factors (e.g. a subgroup of smear grade 1+ patients will have a lower proportion of patients with cavitary disease than a subgroup of smear grade 3+ patients). The median optimal treatment duration and 95% prediction interval of the 500 bootstrapped populations are reported. If all variables are missing, then simulated profiles are for a one-size-fits-all study design.
How is patient adherence assigned?
Risk Stratification Module: 100% adherence is assigned to the subgroup of interest.
Clinical Trial Design Module: 100% adherence for all patients or a pragmatic adherence pattern can be assigned. The pragmatic adherence pattern is based on a pragmatic cluster-randomized trial (N = 4173) that compared treatment monitoring approaches per National Tuberculosis Control Program protocol (self-administered treatment, treatment supervised by family members, or treatment supervised by health care workers; control arm) to electronic reminders (text messages and/or medication monitoring box; intervention arm) (Lui et al., 2015). Results from the control arm was used to simulate pragmatic adherence patterns. In the study, the control arm showed a geometric mean of 22.6% of total doses were missed and 57.4% of patients missed at least 10% of total doses. This tool simulates approximately 14% of total doses missed and approximately 60% of patients missing at least 10% of doses (in addition to 28% of patients missing at least 20% of doses and 80% of patients missing at least 5% of doses).
What are the strengths of our tool?
Our Risk Stratification Tool was developed and validated using nearly 3800 individual-level data from four international registration-quality phase 3 trials conducted across diverse human populations in high-tuberculosis burden settings in South America, sub-Saharan Africa and Asia. Therefore, we provide an evidence-based tool that integrates established patient and disease specific risk factors to predict, with good precision, rates of poor treatment outcomes. We can now inform a priori decisions regarding optimal durations for new regimens being considered for phase 3 clinical trials and design novel phase 3 clinical trials that account for major risk factors. Importantly, our tool is a resource that supports innovative approaches to TB therapy and regimen development programs that are urgently needed in the TB field.
What are the limitations of our tool?
Our parametric model had modest discrimination (area under the receiver operating characteristic curve of 0.72) when including all potential risk factors of poor outcome collected in each trial. However, it should be noted that our goal is not to assign a specific duration for each individual patient, but rather to stratify patients into risk groups that can be assigned appropriate durations. Second, all tested regimens in the studies included in our analysis were rifamycin-containing regimens at standard-suboptimal doses. Predicted optimal treatment durations will likely be underestimated when high-dose rifamycin-containing regimens are considered, especially with the new phase 3 clinical trial data that recently emerged from Study 31/A5349 (NCT02410772) showing non-inferior results between a 4-month high-dose rifapentine regimen with moxifloxacin and the 6-month standard regimen. As clinical trial data from this study become available this tool will be revised. Caution is also advised if generalizing our findings to regimens of other compositions as predictors of poor outcomes may be different. Lastly, the tools necessary to measure risk markers are already in use in many settings, but in some settings (e.g. high-TB-burden settings) the proposed risk markers may not be routinely available with limited access to diagnostics. To address this issue, we have implemented our tool so it can handle missing values for risk assessment (see How is missing data handled?). A full description of the limitations of our model and tools are available in our peer-reviewed publication.
How can the tool be improved?
We plan to continually update and revise our Risk Stratification Tool as more data from emerging phase 3 clinical trials become available. Although, we tested all potential pragmatic risk factors of poor outcomes that were collected in each of the four contemporary phase 3 trials pooled for our analysis, there is still room to improve model and algorithm performance. Certainly, newer and more quantitative and sensitive measures of disease burden and severity (e.g. cycle threshold in GeneXpert) are now becoming available. Future trials that test stratified medicine approaches to TB care should evaluate newer measures, which in turn would allow for algorithms for selecting duration to be further refined and expanded, offering additional characteristics and options for determining risk. Our tool provides the framework that can subsequently be revised to account for better and more robust markers of poor treatment outcomes.
Disclaimer
The information contained herein is for research purposes only and not intended for clinical use. This tool does not provide medical advice. Every effort has been made to ensure that the model and algorithm underlying the Risk Stratification Tool is robust and the methods have been subject to rigorous academic peer review. Users are encouraged to support the information contained herein with other sources.
Publications
Foundational peer-reviewed publications:
Imperial, M.Z., Phillips, P.P.J., Nahid, P. et al. Precision-enhancing risk stratification tools for selecting optimal treatment durations in tuberculosis clinical trials. AJRCCM 204(9):1086-1096 (2021). https://doi.org/10.1164/rccm.202101-0117OC
Imperial, M.Z., Nahid, P., Phillips, P.P.J. et al. A patient-level pooled analysis of treatment-shortening regimens for drug-susceptible pulmonary tuberculosis. Nat Med 24, 1708–1715 (2018). https://doi.org/10.1038/s41591-018-0224-2
Acknowledgements
We thank the study participants; the staff at clinical sites; all investigators for each of the four trials; the data management team at Critical Path Institute. The standardized individual, de-identified data for the OFLOTUB (NCT0021638), REMoxTB (NCT00864383), and RIFAQUIN (ISRCTN44153044) trials that support the development of this tool are publicly available to qualified researchers through the Platform for Aggregation of Clinical TB Studies (TB-PACTS). The DMID 01-009 (NCT00130247) data that support the findings of this study are available from the Tuberculosis Research Unit at Case Western Reserve University, but restrictions apply to the availability of these data, which were used under agreement for the current study. Data are however available from the authors upon reasonable request and with permission from the Tuberculosis Research Unit.

Please contact us for any questions, ideas, or feedback about our tool at marjorie.imperial@ucsf.edu or rada.savic@ucsf.edu.
This project was sponsored by the Critical Path Institute and Bill and Melinda Gates Foundation (OPP1776259) and the US National Institute of Allergy and Infectious Diseases (NIAID; 1R01AI135124-01A1). Its contents are solely the responsibility of the authors and do not necessarily represent the official views of the sponsors.
Risk Stratification Module
This module uses available information on patient characteristics to assign risk groups and predict optimal treatment durations for the subgroup of interest.
...
How it works: The risk score for a subgroup of interest with the selected patient characteristics is calculated based on exact regression coefficients of predictors of TB-related outcomes (failures, relapse, recurrence, TB-related deaths) in the parametric time-to-event model. The parametric model, calculated risk score, and target cure rate are used to assign risk groups and predict optimal treatment durations for the subgroup of interest. The optimal treatment is for a standard-dose rifamycin-containing regimen with a 7/7 weekly dosing schedule. Subgroups with optimal treatment duration of ≤18 weeks to reach the target cure rate is assigned to the low risk group; 19 to 24 weeks to the moderate risk group; and >24 weeks to the high risk group. See Frequently Asked Questions (How was the model and risk stratification algorithm developed?) in the About tab and our peer-reviewed publication for full details on the model and risk stratification algorithm development.
Instructions: Select whether baseline factors only or baseline and months 2 culture factors are available. Select patient characteristics for a subgroup of interest. Select the target cure rate, defined as the target proportion of patients who do not have a TB-related outcome (proportion cured) at 18 months after the start of treatment. Click the Calculate button.
The user can specify when a patient characteristic is missing. Missing data on patient characteristics is handled by bootstrapping (with replacement) 500 participants from a subset of the pooled population from the original studies with the same available risk factors. The median risk score of the bootstrapped population is used to assign risk groups and predict optimal treatment duration. If all patient characteristics are missing, then the reported risk group and optimal treatment duration are for the average patient in the pooled population.
Patient Characteristics
Target Cure Rate
Risk Group and Optimal Treatment Duration
Clinical Trial Design Module
This module performs model simulations that can inform optimal treatment durations to test in clinical trials based on the study design (e.g. one-size-fits-all, subgroup analysis, enrichment, or risk stratification study designs).
...
How it works: Model simulations (500) are performed using the parametric time-to-event model that predicts time to TB-related outcomes to assess the proportion of cured patients following 8 to 36 weeks of treatment with a standard-dose rifamycin-containing regimen. Simulations for a one-size-fits-all, subgroup analysis, enrichment, or risk stratification study design can be performed. The population included in simulations is specified under Patient Settings. The Patient Setting prompts will depend on the selected study design (see Description of Study Designs). The tool is not intended to predict clinical trial outcomes, rather to inform patient subgroups at higher risk of unfavorable outcome and to select optimal treatment durations to test in clinical trials. Therefore, the sample size of each simulated population will be the size of the subset of the pooled population with the selected options in Patient Settings. A summary of simulation specifications (Study Design, Therapy Settings, and Patient Settings) and the optimal treatment duration for the selected target cure rate is reported. Additionally, the median (solid line) and 95% prediction interval (shaded areas) of the proportion of cured patients from 500 simulations are plotted. Wider prediction intervals indicate relatively smaller subset of patients from the original studies with the selected options and more uncertainty in simulations. If the subset of patients is less than 50, the plot(s) are not shown due to high uncertainty in the predictions. Black dashed line shows the target cure rate. See Description of Study Designs for additional information.
Instructions: Under Therapy Settings, select a study design, adherence pattern for the population (100% for all patients or pragmatic adherence) and target cure rate. The target cure rate is defined as the target proportion of patients who do not have a TB-related outcome (proportion cured) at 18 months after the start of treatment. Additional prompts under Patient Settings will appear depending on the study design selected (see Description of Study Designs). Once selections are made for Therapy and Patient Settings. Click the Run Simulation button.
Description of Study Designs
One-size-fits-all study: ... A one-size-fits all study will include all patients pooled from the original studies used for model development (N=3405) to perform simulations. Patient settings are set by default to include all patients in the simulation.
Subgroup analysis study: ... A subgroup analysis study will perform simulations for a population based on selected patient characteristics (risk factors). The sample size of each simulation will be the size of the subset of the pooled population with the selected patient characteristics. The user can specify when a patient characteristic is missing. Missing data on patient characteristics is handled by bootstrapping (with replacement) 500 populations from the subset of the pooled population from the original studies with the same available risk factors and using the bootstrapped populations for model simulations. The sample size of each bootstrap population is the size of the subset of the pooled population with the same available risk factors. Each bootstrapped population will have a distribution of the missing patient characteristic that is approximately the distribution observed in the original studies. For example, if cavitary disease status is missing, the subset of the pooled population with the same available risk factors are used to bootstrap populations for model simulations and approximately 60-70% of patients in each bootstrap population will have cavitary disease The exact proportion will depend on available information of other risk factors (e.g. a subgroup of smear grade 1+ patients will have a lower proportion of patients with cavitary disease than a subgroup of smear grade 3+ patients). The median optimal treatment duration and 95% prediction interval of the 500 bootstrapped populations are reported. If all variables are missing, then simulated profiles are for a one-size-fits-all study design.
Enrichment study: ... An enrichment study will perform simulations for a population enriched for the selected risk factors. If a risk factor is to be enriched, then only patients with that risk factor are included in the simulations. For example, if patients with cavitary disease is to be enriched, then patients with non-cavitary disease are not included in the simulations. If a variable is not used for enrichment, then all groups for that variable are included in the simulations. The sample size of each simulation will be the size of the subset of the pooled population with the selected risk factors for enrichment.
Risk stratification study: ... A risk stratification study will perform simulations for each risk strata based on the patient characteristics selected for stratification. The sample size of each risk strata will be the size of the subset of the pooled population within the risk strata. If a variable is not used for risk stratification, then each risk strata will include all groups for that variable. To simplify simulations, sex will not be used to stratify patients. Therefore, each risk strata will include approximately 70% males and 30% females. The exact proportion will depend on the risk strata. Additionally, only baseline factors will be used to stratify patients (i.e. month 2 culture status is not used for stratification). The output plot will be stratified for each risk strata.
Therapy Settings
Patient Settings
Patient Settings (cont.)
Summary of simulation specifications and results
Treatment durations
ui.R
#Libraries-------
library(shinydashboard)
library(DT)
###########################
#########Sidebar#########
###########################
sidebar <- dashboardSidebar(
hr(),
sidebarMenu(
id="tabs",
menuItem("About", tabName = "about", icon = icon("info-circle"), selected = TRUE),
menuItem("Risk Stratification Module", tabName = "risk_score", icon = icon("calculator")),
menuItem("Clinical Trial Design Module", tabName = "trt_duration", icon = icon("chart-line"))#,
# menuItem("Acknowledgements", tabName = "Ack", icon = icon("handshake")),
# menuItem("Citation", tabName = "Cite", icon = icon("link")),
# menuItem("Codes", icon = icon("file-text-o"),
# menuSubItem("ui.R", tabName = "ui", icon = icon("angle-right")),
# menuSubItem("server.R", tabName = "server", icon = icon("angle-right")))
),
hr()
)
###########################
######### Body #########
###########################
body <- dashboardBody(
tabItems(
###########################
#### About ####
###########################
tabItem(tabName = "about",
fluidRow(
box(title = HTML("<span style='font-size: 125%;'>Welcome to UCSF's Risk Stratification Tool for Tuberculosis Clinical Trial Design!</span>"),
width = 12, collapsible = F,
status = 'primary', solidHeader = F,
includeHTML("descriptions/about.html")
)),
fluidRow(
# style = 'height:40vh',
box(collapsible = F, status = 'warning', width =12,
column( width =6,
HTML("<span style='font-size: 125%;color: black'><div style='text-align: center'><u>Risk Stratification Module</u></div></span>"),
# column(width = 12, height = 3, includeHTML("descriptions/RiskScoreAboutMain.html")),
# br(),
br(),
includeHTML("descriptions/RiskScoreAboutMain.html"),
# a(HTML("<div style='text-align: center'>Click here to use the module</div>"), href="#shiny-tab-risk_score", "data-toggle" = "tab") ,
# br(),
br(),
# imageOutput("image_trt_dur_about")
img(src='riskstratmodule_AI.png',
height = '75%', width = '75%',
style="display: block; margin-left: auto; margin-right: auto;"),
style='border-right: 1px solid grey',
br()
),
column( width =6, status = 'warning',collapsible = F,
HTML("<span style='font-size: 125%;color: black'><div style='text-align: center'><u>Clinical Trial Design Module</u></div></span>"),
# br(),
# column(width = 12, height = 3, includeHTML("descriptions/TreatmentDurationAboutMain.html")),
br(),
includeHTML("descriptions/TreatmentDurationAboutMain.html"),
# a(HTML("<div style='text-align: center'>Click here to use the module</div>"), href="#shiny-tab-trt_duration", "data-toggle" = "tab") ,
# br(),
# imageOutput("image_trt_dur_about")
img(src='TRT_DUR.png', align = "center",
height = '95%', width = '95%',
style="display: block; margin-left: auto; margin-right: auto;"),
br()
),
column(width= 6,
br(),
actionButton(inputId = "Riskmodule", label = "Go to Risk Stratification Module",
style = "
color: black;
background-color: lightgray"),
br(),
align = "center"
),
column(width= 6,
br(),
actionButton(inputId = "ClinDesignModule", label = "Go to Clinical Trial Design Module",
style = "
color: black;
background-color: lightgray"),
br(),
align = "center"
)
)),
fluidRow(
box(title = HTML("<div id='questions-FAQ'>Frequently Asked Questions</div>"), width = 12, collapsible = T,
status = 'primary', solidHeader = T, collapsed = T,
box(title = HTML("<div style='text-align: center'>Who is the tool for?</div>"), width = 12, collapsible = T,
collapsed = T, solidHeader=TRUE,
includeHTML("descriptions/questions/Whoisthetoolfor.html")
) ,
box(title = "What data was used to develop and validate the tool?", width = 12, collapsible = T,
collapsed = T, solidHeader=TRUE,
includeHTML("descriptions/questions/Whatdataused.html")
),
box(title = "What data inputs are required?", width = 12, collapsible = T,
collapsed = T, solidHeader=TRUE,
includeHTML("descriptions/questions/datainputs.html")
),
box(title = "What efficacy outcome was modeled and how is the target cure rate defined?", width = 12, collapsible = T,
collapsed = T, solidHeader=TRUE,
includeHTML("descriptions/questions/efficacyoutcome.html")
),
box(title = "What are the main assumptions for the tool?", width = 12, collapsible = T,
collapsed = T, solidHeader=TRUE,
includeHTML("descriptions/questions/modelassumptions.html")
),
box(title = "How was the model and risk stratification algorithm developed?", width = 12, collapsible = T,
collapsed = T, solidHeader=TRUE,
column(12, includeHTML("descriptions/questions/riskscorei.html")),
column(1),
column(10, img(src='riskscorei.png', align = "center",
height = '100%', width = '100%',
style="display: block; margin-left: auto; margin-right: auto;")),
column(1),
# column(1),
# column(10,
# img(src='riskscorei3.png', align = "center",
# height = '100%', width = '100%',
# style="display: block; margin-left: auto; margin-right: auto;")),
# column(1),
column(12, includeHTML("descriptions/questions/riskscorei_part2.html")),
column(1),
column(10,
img(src='riskscoreparam.png', align = "center",
height = '50%', width = '50%',
style="display: block; margin-left: auto; margin-right: auto;")),
column(1),
br(),
column(12, includeHTML("descriptions/questions/optimaldurcalc.html")),
column(10,
img(src='optimaldurcalc.png', align = "center",
height = '70%', width = '70%',
style="display: block; margin-left: auto; margin-right: auto;")),
column(1),
column(12, includeHTML("descriptions/questions/optimaldurcalc_part2.html"))
),
box(title = HTML("<div id='questions-missing'>How is missing data handled?</div>"), width = 12, collapsible = T,
collapsed = T,solidHeader=TRUE,
includeHTML("descriptions/questions/missingdata.html")
),
box(title = "How is patient adherence assigned?", width = 12, collapsible = T,
collapsed = T, solidHeader=TRUE,
includeHTML("descriptions/questions/adherence.html")
),
# fluidRow(
# box(title = "How is it different from other models?", width = 12, collapsible = T,
# status = 'primary', solidHeader = T, collapsed = T ,
# includeHTML("descriptions/questions/comparetoothers.html")
#
# )),
box(title = "What are the strengths of our tool?", width = 12, collapsible = T,
collapsed = T, solidHeader=TRUE,
includeHTML("descriptions/questions/strengths.html")
),
box(title = "What are the limitations of our tool?", width = 12, collapsible = T,
collapsed = T, solidHeader=TRUE,
includeHTML("descriptions/questions/limitations.html")
),
box(title = "How can the tool be improved?", width = 12, collapsible = T,
collapsed = T, solidHeader=TRUE,
includeHTML("descriptions/questions/improvements.html")
))),
fluidRow(
box(title = "Disclaimer", width = 12, collapsible = T,
status = 'primary', solidHeader = T, collapsed = T,
column(12, includeHTML("descriptions/questions/disclaimer.html") )
),
box(title = "Publications", width = 12, collapsible = T,
status = 'primary', solidHeader = T, collapsed = T,
column(12, includeHTML("descriptions/questions/publication.html") )
),
box(title = "Acknowledgements", width = 12, collapsible = T,
status = 'primary', solidHeader = T, collapsed = T,
column(12, includeHTML("descriptions/questions/Acknowledgements.html"))
)),
fluidRow(
box(width = 12,
status = 'primary', solidHeader = F,
headerBorder = FALSE,
column(3,
img(src='UCSFCenterTB.jpeg',
height = '80%', width = '80%',
style="display: block; margin-left: auto; margin-right: auto;")
),
column(9,
br(),
includeHTML("descriptions/questions/contactus.html"),
br(),
includeHTML("descriptions/questions/funding.html")
)
)
)
),
###########################
#### Risk Scores ####
###########################
tabItem(tabName = "risk_score",
fluidRow(
box(title = "Risk Stratification Module", width = 12,
includeHTML("descriptions/RiskScoreAbout.html"),
status = 'primary', solidHeader = F
),
fluidRow(
column(width = 6,
box(title = "Patient Characteristics", status = 'primary', width = 12,
selectInput("model_score",label = "Data available:", choices = c('Baseline patient factors only' = "1004i",
'Baseline patient and month 2 culture factors' = "1004h"),
selected = "1004h"),
radioButtons("HIV_score", label = "HIV status",
choices = c("Negative" =0, "Positive" =1, "Missing" = -99),
selected=c('0'),inline = T),
radioButtons("SMEAR_score", label = "Smear grade",
choices = c("Negative or 1+" =1, "2+" =2, "3+" = 3, "Missing" = -99),
selected=c('1'),inline = T),
radioButtons("FEMALE_score", label = "Sex",
choices = c("Male" =0, "Female" =1, "Missing" = -99),
selected=c('0'),inline = T),
radioButtons("CAV_score", label = "Baseline cavitary disease",
choices = c("Present" =1, "Absent" =0, "Missing" = -99),
selected=c('0'),inline = T),
radioButtons("BMI_score_missing", label = "BMI missing?",
choices=c("No" = 0, "Yes" = 1),
selected = c("0"), inline = T),
conditionalPanel(
condition = "input.BMI_score_missing == '0'",
sliderInput("BMI_score", label = HTML("BMI (kg/m<sup>2</sup>)"), min = 12, max = 25, value = 17, step =1)
),
hr(),
br(),
conditionalPanel(
condition = "input.model_score == '1004h'",
radioButtons("M2CUL_score", label = "Month 2 culture status",
choices = c("Positive" =1, "Negative" =0, "Missing" = -99),
selected=c('0'),inline = T)
)
),
box(title = "Target Cure Rate",
status = "primary", width = 12,
sliderInput("target_cure_score",
HTML("Target cure rate<br/><span style='font-weight: normal;'>(0.93 cure rate observed for standard of care regimen in pooled data from original studies)</span>"),
0.85, 0.99, 0.93, step =0.01))
),
column(width = 6,
box(title = "Risk Group and Optimal Treatment Duration", status = "success", solidHeader = TRUE, width = 12,
fluidRow(column(width = 4, actionButton("calc_risk_score",
label = "Calculate",
style = "
color: white;
background-color: #ff9933;
font-weight: bold;
width: 100%;
border-radius: 30px;
text-align:center")),
(column(width = 8, htmlOutput("riskscore_status")))),
br(),
br(),
fluidRow(#column(width = 12, uiOutput("N_original")),
column(width = 12, uiOutput("riskscore")),
column(width = 12, uiOutput("opt_trt_duration_res"))),
htmlOutput("footnote_riskscore")
))
),
br(),
br(),
br()
)
),
###########################
#### Treatment Duration ####
###########################
tabItem(tabName = "trt_duration",
fluidRow(
box(title = "Clinical Trial Design Module", width = 12,
includeHTML("descriptions/TreatmentDurationAbout.html"),
status = 'primary', solidHeader = F
),
box(title = HTML("<div id='study-designs'>Description of Study Designs</div>"), width = 12, collapsible = F,
includeHTML("descriptions/TreatmentDuration_StudyDesign.html"),
status = 'danger', solidHeader = F
),
# box(title = "Patient and Therapy Settings", status = 'primary', width = 4, height = 925,
box(title = "Therapy Settings", status = 'danger', width = 4,
radioButtons("TASK", label = HTML("Study Design<br><span style='font-weight: normal;'><i>(see Description of Study Designs above)</i></span>"),
choices = c("A one-size-fits-all study" = "onesize",
"A subgroup analysis study" ="subgroups",
"An enrichment study" ="enrichment",
"A risk stratification study" = "riskstrata"),
selected="none",inline = F),
# selectInput("adh_trt_dur", label="Adherence",
# choices = c('100% for all patients' = "100")),
selectInput("adh_trt_dur", label="Adherence pattern",
choices = c('100% for all patients' = "100",
'Pragmatic' = "Lui")),
selectInput("ii_trt_dur", label="Dosing frequency", choices = c('7/7 weekly' = "7"
)),
selectInput("inh_trt_dur", label="Regimen composition", choices = c('Isoniazid included' = "1")),
sliderInput("target_cure_trt_dur", HTML("Target cure rate<br/><span style='font-weight: normal;'><i>(0.93 cure rate observed for standard of care regimen in pooled data from original studies)</i></span>"),
0.85, 0.99, 0.93, step =0.01)
),
box(title = "Patient Settings", status = 'danger', width = 4,
# fluidRow(column(12, div(style = "height:40px; font-size:18px;font-weight: normal;",
# "Data to include in simulations:"))),
fluidRow(
column(12, htmlOutput("select_task_prompt")),
# column(12, htmlOutput("subgroup_note")),
# column(12, htmlOutput("enrich_note")),
# column(12, htmlOutput("riskstrata_note")),
#
column(12,
conditionalPanel(condition = "input.TASK == 'onesize'",
radioButtons("HIV_trt_dur_onesize", label = HTML("Data to include in simulations: <br>HIV status:"),
choices = c("All groups" = 100),
selected=c('100'),inline = T)
),
conditionalPanel(condition = "input.TASK == 'subgroups'",
radioButtons("HIV_trt_dur_subgroups",
label = HTML("Data to include in simulations: <br>HIV status:"),
choices = c("Negative" =0, "Positive" =1, "Missing" = 100),
selected=c('0'),inline = T)
),
# conditionalPanel(condition = "input.TASK == 'subgroups' & input.HIV_trt_dur_subgroups == '100'",
# radioButtons("HIV_trt_dur_subgroups_100_missing",
# label = HTML("<i><span style='font-weight: normal;'>What is the reason for selecting 'All groups' for HIV status?</span></i>"),
# choices = c("Missing, include all groups in simulations" =0, "Compare groups in a single output" =1),
# selected=c('0'),inline = T)
# ),
conditionalPanel(condition = "input.TASK == 'enrichment'",
radioButtons("HIV_trt_dur_enrich_quest",
label = HTML("Data to include in simulations: <br>Enrich by HIV status?"),
choices = c("Yes" =1, "No"=0),
selected='0',inline = T)
),
conditionalPanel(condition = "input.TASK == 'enrichment' & input.HIV_trt_dur_enrich_quest == '1'",
radioButtons("HIV_trt_dur_enrich",
label = HTML("<i><span style='font-weight: normal;'>Select HIV status to enrich</span></i>"),
choices = c("Negative" =0, "Positive" =1),
selected=c('0'),inline = T)
),
conditionalPanel(condition = "input.TASK == 'riskstrata'",
radioButtons("HIV_trt_dur_riskstrata_quest",
label = HTML("Is HIV status part of the risk stratification algorithm?"),
choices = c("Yes" =1, "No"=0),
selected='0',inline = T)
)
)
),
hr(),
fluidRow(
column(12,
conditionalPanel(condition = "input.TASK == 'onesize'",
radioButtons("FEMALE_trt_dur_onesize", label = "Sex:",
choices = c("All groups" = 100),
selected=c('100'),inline = T)
),
conditionalPanel(condition = "input.TASK == 'subgroups'",
radioButtons("FEMALE_trt_dur_subgroups",
label = "Sex:",
choices = c("Female" =1, "Male" =0, "Missing" = 100),
selected=c('0'),inline = T)
),
conditionalPanel(condition = "input.TASK == 'enrichment'",
radioButtons("FEMALE_trt_dur_enrich_quest",
label = "Enrich by sex?",
choices = c("Yes" =1, "No"=0),
selected='0',inline = T)
),
conditionalPanel(condition = "input.TASK == 'enrichment' & input.FEMALE_trt_dur_enrich_quest == '1'",
radioButtons("FEMALE_trt_dur_enrich",
label = HTML("<i><span style='font-weight: normal;'>Select sex to enrich</span></i>"),
choices = c("Female" =1, "Male" =0),
selected=c('0'),inline = T)
),
conditionalPanel(condition = "input.TASK == 'riskstrata'",
radioButtons("FEMALE_trt_dur_riskstrata_quest",
label = "Is sex part of the risk stratification algorithm?",
choices = c("No"=0),
selected='0',inline = T)
)
)
),
hr(),
fluidRow(
column(12,
conditionalPanel(condition = "input.TASK == 'onesize'",
radioButtons("BMI_CAT_trt_dur_onesize",
label = HTML("Baseline range for BMI (kg/m<sup>2</sup>):"),
choices = c("All groups" = 100),
selected=c('100'),inline = T)
),
conditionalPanel(condition = "input.TASK == 'subgroups'",
radioButtons("BMI_CAT_trt_dur_subgroups",
label = HTML("Baseline range for BMI (kg/m<sup>2</sup>):"),
choices = c( "BMI \u2265 17" =0, "BMI < 17" =1, "Missing" = 100),
selected=c('0'),inline = T)
),
conditionalPanel(condition = "input.TASK == 'enrichment'",
radioButtons("BMI_CAT_trt_dur_enrich_quest",
label = "Enrich by baseline BMI?",
choices = c("Yes" =1, "No"=0),
selected='0',inline = T)
),
conditionalPanel(condition = "input.TASK == 'enrichment' & input.BMI_CAT_trt_dur_enrich_quest == '1'",
radioButtons("BMI_CAT_trt_dur_enrich",
label = HTML("<i><span style='font-weight: normal;'>Select BMI group to enrich (kg/m<sup>2</sup>)</span></i>"),
choices = c("BMI \u2265 17" =0, "BMI < 17" =1),
selected=c('0'),inline = T)
),
conditionalPanel(condition = "input.TASK == 'riskstrata'",
radioButtons("BMI_CAT_trt_dur_riskstrata_quest",
label = "Is baseline BMI part of the risk stratification algorithm?",
choices = c("Yes" =1, "No"=0),
selected='0',inline = T)
)
)
)),
box(title = "Patient Settings (cont.)", status = 'danger', width = 4,
fluidRow(
column(12,
conditionalPanel(condition = "input.TASK == 'onesize'",
radioButtons("SMEAR_trt_dur_onesize", label = "Baseline smear grade:",
choices = c("All groups" = 100),
selected=c('100'),inline = T)
),
conditionalPanel(condition = "input.TASK == 'subgroups'",
radioButtons("SMEAR_trt_dur_subgroups",
label = "Baseline smear grade:",
choices = c("Neg. or 1+" =1, "2+" =2, "3+" = 3, "Missing" = 100),
selected=c( "3"),inline = T)
),
conditionalPanel(condition = "input.TASK == 'enrichment'",
radioButtons("SMEAR_trt_dur_enrich_quest",
label = "Enrich by baseline smear grade?",
choices = c("Yes" =1, "No"=0),
selected='1',inline = T)
),
conditionalPanel(condition = "input.TASK == 'enrichment' & input.SMEAR_trt_dur_enrich_quest == '1'",
radioButtons("SMEAR_trt_dur_enrich",
label = HTML("<i><span style='font-weight: normal;'>Select smear grade to enrich</span></i>"),
choices = c("Neg. or 1+" =1, "2+" =2, "3+" = 3),
selected=c("3"),inline = T)
),
conditionalPanel(condition = "input.TASK == 'riskstrata'",
radioButtons("SMEAR_trt_dur_riskstrata_quest",
label = "Is baseline smear grade part of the risk stratification algorithm?",
choices = c("Yes" =1, "No"=0),
selected='1',inline = T)
)
)
),
hr(),
fluidRow(
column(12,
conditionalPanel(condition = "input.TASK == 'onesize'",
radioButtons("CAV_trt_dur_onesize", label = "Baseline cavitary disease:",
choices = c("All groups" = 100),
selected=c('100'),inline = T)
),
conditionalPanel(condition = "input.TASK == 'subgroups'",
radioButtons("CAV_trt_dur_subgroups",
label = "Baseline cavitary disease:",
choices = c("Absent" =0, "Present" =1, "Missing" = 100),
selected=c( "1"),inline = T)
),
conditionalPanel(condition = "input.TASK == 'enrichment'",
radioButtons("CAV_trt_dur_enrich_quest",
label = "Enrich by baseline cavitary disease?",
choices = c("Yes" =1, "No"=0),
selected='1',inline = T)
),
conditionalPanel(condition = "input.TASK == 'enrichment' & input.CAV_trt_dur_enrich_quest == '1'",
radioButtons("CAV_trt_dur_enrich",
label = HTML("<i><span style='font-weight: normal;'>Select cavitary disease group to enrich</span></i>"),
choices = c("Absent" =0, "Present" =1),
selected=c("1"),inline = T)
),
conditionalPanel(condition = "input.TASK == 'riskstrata'",
radioButtons("CAV_trt_dur_riskstrata_quest",
label = "Is baseline cavitary disease part of the risk stratification algorithm?",
choices = c("Yes" =1, "No"=0),
selected='1',inline = T)
)
)
),
hr(),
fluidRow(
column(12,
conditionalPanel(condition = "input.TASK == 'subgroups'",
radioButtons("CULM2_trt_dur_subgroups_available_quest", label = "Is month 2 culture status available?",
choices = c("Yes, include it in simulations" =1, "No, perform simulations with baseline factor only"=0),
selected='0',inline = F)
),
conditionalPanel(condition = "input.TASK == 'enrichment'",
radioButtons("CULM2_trt_dur_enrichment_available_quest", label = "Is month 2 culture status available?",
choices = c("Yes, include it in simulations" =1, "No, perform simulations with baseline factor only"=0),
selected='0',inline = F)
),
conditionalPanel(condition = "input.TASK == 'onesize'",
radioButtons("CULM2_trt_dur_onesize", label = "month 2 culture status:",
choices = c("All groups" = 100),
selected=c('100'),inline = T)
),
conditionalPanel(condition = "input.TASK == 'subgroups' & input.CULM2_trt_dur_subgroups_available_quest =='1'",
radioButtons("CULM2_trt_dur_subgroups",
label = "Month 2 culture status:",
choices = c("Negative" =0, "Positive" =1, "Missing" = 100),
selected=c( "0"),inline = T)
),
conditionalPanel(condition = "input.TASK == 'enrichment' & input.CULM2_trt_dur_enrichment_available_quest =='1'",
radioButtons("CULM2_trt_dur_enrich_quest",
label = "Enrich by month 2 culture status?",
choices = c("Yes" =1, "No"=0),
selected='0',inline = T)
),
conditionalPanel(condition = "input.TASK == 'enrichment' & input.CULM2_trt_dur_enrichment_available_quest =='1' & input.CULM2_trt_dur_enrich_quest == '1'",
radioButtons("CULM2_trt_dur_enrich",
label = HTML("<i><span style='font-weight: normal;'>Select culture status group to enrich</span></i>"),
choices = c("Negative" =0, "Positive" =1),
selected=c("0"),inline = T)
),
conditionalPanel(condition = "input.TASK == 'riskstrata'",
radioButtons("CULM2_trt_dur_riskstrata_quest",
label = "Is month 2 culture status part of the risk stratification algorithm?",
choices = c("No"=0),
selected='0',inline = T)
)
)
)
),
# box(title = "Target Cure Rate",status = 'primary', width = 4, height = 300,
# sliderInput("target_cure_trt_dur", "Target cure rate", 0.8, 1, 0.93, step =0.01),
# sliderInput("time_target_cure_trt_dur", "Time of target cure (months since start of treatment)", 12, 18, 18, step =1)),
# box(title = "Plot settings", status = 'danger', width = 12,
# column(12, htmlOutput("plot_subgroup_allgroups_note")),
# fluidRow(
# column(4, selectInput("color_var_trt_dur", label="Color", choices = list("None" = "NONE",
# 'Baseline smear grade' = "SMEAR",
# 'HIV status' = "HIV",
# 'Sex' ="FEMALE",
# 'Baseline Cavitation' = "CAV",
# "Baseline range of BMI" = "BMI_CAT",
# "Month 2 culture status" = "CULM2"),
# selected = "NONE")
# ),
# column(4, selectInput("facet_x_trt_dur", label="X-axis facet", choices = list("None" = "NONE",
# 'Baseline smear grade' = "SMEAR",
# 'HIV status' = "HIV",
# 'Sex' ="FEMALE",
# 'Baseline Cavitation' = "CAV",
# "Baseline range of BMI" = "BMI_CAT",
# "Month 2 culture status" = "CULM2"),
# selected = "NONE")
# ),
# column(4,selectInput("facet_y_trt_dur", label="Y-axis facet", choices = list("None" = "NONE",
# 'Baseline smear grade' = "SMEAR",
# 'HIV status' = "HIV",
# 'Sex' ="FEMALE",
# 'Baseline Cavitation' = "CAV",
# "Baseline range of BMI" = "BMI_CAT",
# "Month 2 culture status" = "CULM2"),
# selected = "NONE")
# )
# )
# ),
box(title = "Summary of simulation specifications and results", status = "success", solidHeader = T, width = 12,
column(width = 3,
actionButton("update_plot_trt_dur",
# label = div("Run simulation", icon("chevron-circle-right")),
label = "Run simulation",
style = "
color: white;
background-color: #ff9933;
font-weight: bold;
width: 100%;
border-radius: 30px;
text-align:center")),
column(width = 6, htmlOutput("trt_dur_plot_status")),
column(12, htmlOutput('missing_data_subgroups')),
column(12, DT::dataTableOutput('summary_table')),
column(12, htmlOutput("trt_dur_summary"))
),
box(title = "Treatment durations", status = "success",solidHeader = TRUE, width = 12,
uiOutput("sim_plot.ui"),
htmlOutput("plot_details")
# HTML("<i>The solid lines in the plot below is the median of the simulations and the shaded area show the 95% prediction interval.</i>")#,
# uiOutput("downloadData")
)
)
),
###########################
#### Acknowledgements ####
###########################
# tabItem(tabName = "Ack",
# box( width = 12,collapsible = FALSE, solidHeader = TRUE, title="Acknowledgements",
# includeHTML("descriptions/Acknowledgements.html"))
# ),
#
###########################
#### Citation ####
###########################
# tabItem(tabName = "Cite",
# box( width = 12,collapsible = FALSE, solidHeader = TRUE, title="Citation",
# includeHTML("descriptions/Citations.html")
# )
# ),
###########################
#### Codes ####
###########################
tabItem(tabName = "ui",
box( width = NULL, solidHeader = TRUE, title="ui.R",
pre(includeText("ui.R"))
)
),
tabItem(tabName = "server",
box( width = NULL, solidHeader = TRUE, title="server.R",
pre(includeText("server.R"))
)
)
)
)
###########################
######### Dashboard #########
###########################
dashboardPage(
dashboardHeader(title = "Risk Stratification Tool"),
sidebar,
body
)
server.R
library("ggplot2")
library("gridExtra")
library("tidyr")
library("dplyr")
library("zipfR")
# library("xpose4")
library("survival")
# library("tinytex")
# library("survminer")
library("cowplot")
library("DT")
source("functions_parameters/RISKSCORE_PAR.R")
load("functions_parameters/RAWDATA_FIT_1004h.RData")
load("functions_parameters/RAWDATA_FIT_1004h_COVARIATES.RData")
source("functions_parameters/TRT_DUR_functions.R")
load("functions_parameters/TRT_DUR_SIMULATION_RAWDATA_1004h.RData")
SIM_FULLADH = sim.data_originalfit
DATA_FULLADH = data
load("functions_parameters/TRT_DUR_SIMULATION_RAWDATA_1004h_pragahd.RData")
DATA_PRAGADH = data
SIM_PRAGADH = sim.data_originalfit
source("functions_parameters/plot_function.R")
server <- function(input, output,session) {
# output$image_trt_dur_about <- renderImage({
# filename <- normalizePath(file.path(paste0('www/', "TreatmentDurationAboutMainimgv2", '.png')))
# list(
# src = filename#,
# # height = 200
# )
# }, deleteFile = FALSE)
observeEvent(input$Riskmodule, {
updateTabsetPanel(session = session, inputId = "tabs", selected = "risk_score")
})
observeEvent(input$ClinDesignModule, {
updateTabsetPanel(session = session, inputId = "tabs", selected = "trt_duration")
})
###########################
#### Treatment Duration ####
###########################
STATUS_TRT_DUR_PLOT <- reactiveVal()
SUMMARY_STATEMENT <- reactiveVal()
SUMMARY_TABLE <- reactiveVal()
SUMMARY_TABLE_DF <- reactiveVal()
MISSINGDATA_TEXT <- reactiveVal()
PLOT_DETAILS <- reactiveVal()
v <- reactiveValues(clearPlot = TRUE, clear_score = T)
observeEvent({list(
input$TASK,
input$adh_trt_dur,
input$ii_trt_dur,
input$inh_trt_dur,
input$target_cure_trt_dur,
input$HIV_trt_dur_onesize,
input$HIV_trt_dur_subgroups,
input$HIV_trt_dur_enrich_quest,
input$HIV_trt_dur_enrich,
input$HIV_trt_dur_riskstrata_quest,
input$FEMALE_trt_dur_onesize,
input$FEMALE_trt_dur_subgroups,
input$FEMALE_trt_dur_enrich_quest,
input$FEMALE_trt_dur_enrich,
input$FEMALE_trt_dur_riskstrata_quest,
input$BMI_CAT_trt_dur_onesize,
input$BMI_CAT_trt_dur_subgroups,
input$BMI_CAT_trt_dur_enrich_quest,
input$BMI_CAT_trt_dur_enrich,
input$BMI_CAT_trt_dur_riskstrata_quest,
input$SMEAR_trt_dur_onesize,
input$SMEAR_trt_dur_subgroups,
input$SMEAR_trt_dur_enrich_quest,
input$SMEAR_trt_dur_enrich,
input$SMEAR_trt_dur_riskstrata_quest,
input$CAV_trt_dur_onesize,
input$CAV_trt_dur_subgroups,
input$CAV_trt_dur_enrich_quest,
input$CAV_trt_dur_enrich,
input$CAV_trt_dur_riskstrata_quest,
input$CULM2_trt_dur_subgroups_available_quest,
input$CULM2_trt_dur_enrichment_available_quest,
input$CULM2_trt_dur_onesize,
input$CULM2_trt_dur_subgroups,
input$CULM2_trt_dur_enrich_quest,
input$CULM2_trt_dur_enrich,
input$CULM2_trt_dur_riskstrata_quest
)},
{
v$clearPlot <- TRUE
STATUS_TRT_DUR_PLOT("<B><font color='red'>Inputs changed, resimulation required</font></B>")
PLOT_DETAILS()
SUMMARY_STATEMENT()
}, priority = 10)
observeEvent(input$update_plot_trt_dur, {
v$clearPlot <- FALSE
}, priority = 10)
TRT_DUR_reactive = eventReactive(input$update_plot_trt_dur,{
########
print("start")
print(Sys.time())
########
# read in and use the correct dataset ########
if(input$adh_trt_dur == "100" & input$ii_trt_dur == "7"){
FIT_DATA = DATA_FULLADH %>%
mutate(ALL = 1)
SIM_DATA = SIM_FULLADH %>%
mutate(ALL = 1)
}
if(input$adh_trt_dur == "Lui" & input$ii_trt_dur == "7"){
FIT_DATA = DATA_PRAGADH %>%
mutate(ALL = 1)
SIM_DATA = SIM_PRAGADH %>%
mutate(ALL = 1)
}
# sample_simNum = sample(1:100, 100, replace = F)
# SIM_DATA = SIM_DATA %>%
# filter(simNumber %in% sample_simNum)
#
incProgress(amount = 0.25)
########
# assign variable to other inputs ########
# target cure rate
TIMEEFFECT_TRT_DUR = 18
TARGET_CURE_TRT_DUR = input$target_cure_trt_dur
# plotting options
if(input$TASK != "riskstrata"){
COLOR_TRT_DUR = 'NONE'
FACET_X_TRT_DUR = 'NONE'
FACET_Y_TRT_DUR = 'NONE'
}else{
if(input$SMEAR_trt_dur_riskstrata_quest =='1'){
FACET_X_TRT_DUR = 'SMEAR'
}else{
FACET_X_TRT_DUR = 'NONE'
}
if(input$HIV_trt_dur_riskstrata_quest =='1'){
FACET_Y_TRT_DUR = 'HIV'
}else{
FACET_Y_TRT_DUR = 'NONE'
}
if(input$CAV_trt_dur_riskstrata_quest =='1'){
COLOR_TRT_DUR = 'CAV'
}else{
COLOR_TRT_DUR = 'NONE'
}
}
# print(FACET_Y_TRT_DUR)
# print(COLOR_TRT_DUR)
# print(FACET_X_TRT_DUR)
HIV_trt_dur_values = c(0, 1)
SMEAR_trt_dur_values = c(1, 2, 3)
FEMALE_trt_dur_values = c(0, 1)
CAV_trt_dur_values = c(0, 1)
BMI_CAT_trt_dur_values = c(0, 1)
CULM2_trt_dur_values = c(0, 1)
# if(input$TASK == "riskstrata" | input$TASK == "onesize"){
# HIV_trt_dur_values = c(0, 1, NA)
# SMEAR_trt_dur_values = c(1, 2, 3, NA)
# FEMALE_trt_dur_values = c(0, 1, NA)
# CAV_trt_dur_values = c(0, 1, NA)
# BMI_CAT_trt_dur_values = c(0, 1, NA)
# CULM2_trt_dur_values = c(0, 1, NA)
# }
#assign variables based on task, one size uses all so dont need if statment
if(input$TASK == 'subgroups'){
if(input$HIV_trt_dur_subgroups != 100){
HIV_trt_dur_values = input$HIV_trt_dur_subgroups
}
if(input$FEMALE_trt_dur_subgroups != 100){
FEMALE_trt_dur_values = input$FEMALE_trt_dur_subgroups
}
if(input$BMI_CAT_trt_dur_subgroups != 100){
BMI_CAT_trt_dur_values = input$BMI_CAT_trt_dur_subgroups
}
if(input$SMEAR_trt_dur_subgroups != 100){
SMEAR_trt_dur_values = input$SMEAR_trt_dur_subgroups
}
if(input$CAV_trt_dur_subgroups != 100){
CAV_trt_dur_values = input$CAV_trt_dur_subgroups
}
if(input$CULM2_trt_dur_subgroups_available_quest == 1 & input$CULM2_trt_dur_subgroups != 100){
CULM2_trt_dur_values = input$CULM2_trt_dur_subgroups
}
}
if(input$TASK == 'enrichment'){
if(input$HIV_trt_dur_enrich_quest == 1){
HIV_trt_dur_values = input$HIV_trt_dur_enrich
}
if(input$FEMALE_trt_dur_enrich_quest == 1){
FEMALE_trt_dur_values = input$FEMALE_trt_dur_enrich
}
if(input$BMI_CAT_trt_dur_enrich_quest == 1){
BMI_CAT_trt_dur_values = input$BMI_CAT_trt_dur_enrich
}
if(input$SMEAR_trt_dur_enrich_quest == 1){
SMEAR_trt_dur_values = input$SMEAR_trt_dur_enrich
}
if(input$CAV_trt_dur_enrich_quest == 1){
CAV_trt_dur_values = input$CAV_trt_dur_enrich
}
if(input$CULM2_trt_dur_enrichment_available_quest == 1 & input$CULM2_trt_dur_enrich_quest == 1){
CULM2_trt_dur_values = input$CULM2_trt_dur_enrich
}
}
# print(paste("HIV", paste(HIV_trt_dur_values, collapse = " ")))
# print(paste("FEMALE", paste(FEMALE_trt_dur_values, collapse = " ")))
# print(paste("BMI", paste(BMI_CAT_trt_dur_values, collapse = " ")))
# print(paste("SMEAR", paste(SMEAR_trt_dur_values, collapse = " ")))
# print(paste("CAV", paste(CAV_trt_dur_values, collapse = " ")))
# print(paste("CULM2", paste(CULM2_trt_dur_values, collapse = " ")))
# filter data base on selected inputs ######
if(length(HIV_trt_dur_values) >= 2 &
length(SMEAR_trt_dur_values) >= 3 &
length(FEMALE_trt_dur_values) >= 2 &
length(CAV_trt_dur_values) >= 2 &
length(BMI_CAT_trt_dur_values) >= 2 &
# length(input$AGE_CAT_trt_dur) >= 2 &
length(CULM2_trt_dur_values) >= 2 ) {
SIM_DATA = SIM_DATA
} else{
SIM_DATA = SIM_DATA %>%
filter(HIV %in% HIV_trt_dur_values) %>%
filter(SMEAR %in% SMEAR_trt_dur_values) %>%
filter(FEMALE %in% FEMALE_trt_dur_values) %>%
filter(CAV %in% CAV_trt_dur_values) %>%
filter(BMI_CAT %in% BMI_CAT_trt_dur_values) %>%
# filter(AGE_CAT %in% input$AGE_CAT_trt_dur) %>%
# filter(AFSITE %in% input$AFSITE_trt_dur) %>%
filter(CULM2 %in% CULM2_trt_dur_values)
}
SIM_DATA_forNcalc = SIM_DATA %>%
filter(simNumber == 1) %>%
filter(counter == 1) %>%
filter(DATOT3 == 24*7)
if(input$TASK == "subgroups"){
if( sum(as.numeric(as.character(c(input$HIV_trt_dur_subgroups,
input$SMEAR_trt_dur_subgroups,
input$FEMALE_trt_dur_subgroups,
input$CAV_trt_dur_subgroups,
input$BMI_CAT_trt_dur_subgroups,
# input$AGE_CAT_trt_dur_subgroups,
input$CULM2_trt_dur_subgroups)))) >= 100) {
# MISSINGDATA_TEXT()
MISSINGIDS = unique(SIM_DATA$ID)
# print(paste("size ID" , length(MISSINGIDS)))
SIM_DATA_MISSING = NULL
bootstraps = 500
SIM_DATA_MISSING = lapply(1:bootstraps, FUN = sample.data.func,
sim.data.orig = SIM_DATA,
missing.ids = MISSINGIDS,
input = input) %>%
bind_rows()
SIM_DATA = SIM_DATA_MISSING
}
}
# SIM_DATA %>%
# select(ID) %>%
# unique() %>%
# length() %>%
# print()
# xx = SIM_DATA %>%
# filter(counter == 1) %>%
# group_by(simNumber, HIV) %>%
# summarize(N = n()) %>%
# group_by(simNumber) %>%
# mutate(PROP = N/sum(N)) %>%
# filter(HIV == 1)
#
# p1 = xx %>%
# ggplot() +
# geom_histogram(aes(x= PROP))
#
# print(p1)
#
# print(summary(xx$PROP))
#
FIT_DATA = FIT_DATA %>%
filter(HIV %in% HIV_trt_dur_values) %>%
filter(SMEAR %in% SMEAR_trt_dur_values) %>%
filter(FEMALE %in% FEMALE_trt_dur_values) %>%
filter(CAV %in% CAV_trt_dur_values) %>%
filter(BMI_CAT %in% BMI_CAT_trt_dur_values) %>%
# filter(AGE_CAT %in% input$AGE_CAT_trt_dur) %>%
# filter(AFSITE %in% input$AFSITE_trt_dur) %>%
filter(CULM2 %in% CULM2_trt_dur_values)
# incProgress(amount = 0.50)
# print(COLOR_TRT_DUR)
######
# if not color or faceting ######
# color plot either none or by cavitation for risk stratification plots
if(COLOR_TRT_DUR == "NONE"){
# do a complete simulation
COLOR_TRT_DUR_VALUE = "NONE"
} else {
COLOR_TRT_DUR_VALUE = c(0, 1)
}
# x facet either none or by smear for risk stratification plots
if(FACET_X_TRT_DUR == "NONE"){
# do a complete simulation
FACET_X_TRT_DUR_VALUE = "NONE"
} else {
FACET_X_TRT_DUR_VALUE = c(1, 2, 3)
}
# y facet either none or by hihv for risk stratification plots
if(FACET_Y_TRT_DUR == "NONE"){
# do a complete simulation
FACET_Y_TRT_DUR_VALUE = "NONE"
} else {
FACET_Y_TRT_DUR_VALUE =c(0, 1)
}
#######
#color, facet combinations
COMBINATIONS_PLOT = expand.grid(COLOR_TRT_DUR_VALUE,
FACET_X_TRT_DUR_VALUE,
FACET_Y_TRT_DUR_VALUE)
colnames(COMBINATIONS_PLOT) = c(COLOR_TRT_DUR, FACET_X_TRT_DUR, FACET_Y_TRT_DUR)
if(input$TASK != 'riskstrata'){
PLOT_DATA_TRT_DUR = lapply(1:nrow(COMBINATIONS_PLOT), lapply.data.function.format,
combo = COMBINATIONS_PLOT,
sim.data = SIM_DATA,
fit.data = FIT_DATA,
timepoint = TIMEEFFECT_TRT_DUR,
COLOR_TRT_DUR = COLOR_TRT_DUR,
FACET_X_TRT_DUR = FACET_X_TRT_DUR,
FACET_Y_TRT_DUR = FACET_Y_TRT_DUR) %>%
bind_rows()
PLOT_TRT_DUR = PLOT_FUNCTION(PLOT_DATA_TRT_DUR=PLOT_DATA_TRT_DUR, TARGET_CURE_TRT_DUR = TARGET_CURE_TRT_DUR,
COLOR_TRT_DUR = COLOR_TRT_DUR, FACET_X_TRT_DUR = FACET_X_TRT_DUR, FACET_Y_TRT_DUR = FACET_Y_TRT_DUR,
TASK = input$TASK)
}
if(input$TASK == 'riskstrata'){
if(input$BMI_CAT_trt_dur_riskstrata_quest == 1){
SIM_DATA_LOWBMI = SIM_DATA %>%
filter(BMI_CAT %in% c(1))
FIT_DATA_LOWBMI = FIT_DATA %>%
filter(BMI_CAT %in% c(1))
PLOT_DATA_TRT_DUR_LOWBMI = lapply(1:nrow(COMBINATIONS_PLOT), lapply.data.function.format,
combo = COMBINATIONS_PLOT,
sim.data = SIM_DATA_LOWBMI,
fit.data = FIT_DATA_LOWBMI,
timepoint = TIMEEFFECT_TRT_DUR,
COLOR_TRT_DUR = COLOR_TRT_DUR,
FACET_X_TRT_DUR = FACET_X_TRT_DUR,
FACET_Y_TRT_DUR = FACET_Y_TRT_DUR) %>%
bind_rows()
PLOT_TRT_DUR_LOWBMI = PLOT_FUNCTION(PLOT_DATA_TRT_DUR = PLOT_DATA_TRT_DUR_LOWBMI, TARGET_CURE_TRT_DUR = TARGET_CURE_TRT_DUR,
COLOR_TRT_DUR = COLOR_TRT_DUR, FACET_X_TRT_DUR = FACET_X_TRT_DUR, FACET_Y_TRT_DUR = FACET_Y_TRT_DUR,
TASK = input$TASK) +
ggtitle(expression(bold(underline("BMI < 17"~kg/m^2))))+
# theme(plot.title=element_text(size = 20, vjust=-5, hjust = -0.03))+
theme(plot.title=element_text(size = 20))+
theme(plot.margin = unit(c(1,0,0,0), "cm"))+
theme(panel.spacing = unit(1, "cm"))
SIM_DATA_HIGHBMI = SIM_DATA %>%
filter(BMI_CAT %in% c(0))
FIT_DATA_HIGHBMI = FIT_DATA %>%
filter(BMI_CAT %in% c(0))
PLOT_DATA_TRT_DUR_HIGHBMI = lapply(1:nrow(COMBINATIONS_PLOT), lapply.data.function.format,
combo = COMBINATIONS_PLOT,
sim.data = SIM_DATA_HIGHBMI,
fit.data = FIT_DATA_HIGHBMI,
timepoint = TIMEEFFECT_TRT_DUR,
COLOR_TRT_DUR = COLOR_TRT_DUR,
FACET_X_TRT_DUR = FACET_X_TRT_DUR,
FACET_Y_TRT_DUR = FACET_Y_TRT_DUR) %>%
bind_rows()
PLOT_TRT_DUR_HIGHBMI = PLOT_FUNCTION(PLOT_DATA_TRT_DUR = PLOT_DATA_TRT_DUR_HIGHBMI, TARGET_CURE_TRT_DUR = TARGET_CURE_TRT_DUR,
COLOR_TRT_DUR = COLOR_TRT_DUR, FACET_X_TRT_DUR = FACET_X_TRT_DUR, FACET_Y_TRT_DUR = FACET_Y_TRT_DUR,
TASK = input$TASK) +
ggtitle(expression(bold(underline("BMI \u2265 17"~kg/m^2))) )+
# theme(plot.title=element_text(size = 20, vjust=-5, hjust = -0.03))+
theme(plot.title=element_text(size = 20))+
theme(plot.margin = unit(c(0,0,1,0), "cm")) +
theme(panel.spacing = unit(1, "cm"))
PLOT_TRT_DUR = cowplot::plot_grid(PLOT_TRT_DUR_HIGHBMI, PLOT_TRT_DUR_LOWBMI, ncol = 1)
PLOT_DATA_TRT_DUR = bind_rows(mutate(PLOT_DATA_TRT_DUR_HIGHBMI, HIGH_BMI = 1),
mutate(PLOT_DATA_TRT_DUR_LOWBMI, HIGH_BMI = 0))
}else{
PLOT_DATA_TRT_DUR = lapply(1:nrow(COMBINATIONS_PLOT), lapply.data.function.format,
combo = COMBINATIONS_PLOT,
sim.data = SIM_DATA,
fit.data = FIT_DATA,
timepoint = TIMEEFFECT_TRT_DUR,
COLOR_TRT_DUR = COLOR_TRT_DUR,
FACET_X_TRT_DUR = FACET_X_TRT_DUR,
FACET_Y_TRT_DUR = FACET_Y_TRT_DUR) %>%
bind_rows()
PLOT_TRT_DUR = PLOT_FUNCTION(PLOT_DATA_TRT_DUR=PLOT_DATA_TRT_DUR, TARGET_CURE_TRT_DUR = TARGET_CURE_TRT_DUR,
COLOR_TRT_DUR = COLOR_TRT_DUR, FACET_X_TRT_DUR = FACET_X_TRT_DUR, FACET_Y_TRT_DUR = FACET_Y_TRT_DUR,
TASK = input$TASK)
PLOT_DATA_TRT_DUR = PLOT_DATA_TRT_DUR %>%
mutate(HIGH_BMI = -99)
}
}
# print(filter(PLOT_DATA_TRT_DUR, TOTAL_DA == 24))
# print(PLOT_DATA_TRT_DUR)
# FIT_DATA = FIT_DATA%>%
# filter(EVID == 0)
# print(nrow(FIT_DATA_test))
SUMMARY = summarystatment_text(input, plot_data = PLOT_DATA_TRT_DUR, raw_data = FIT_DATA)
SUMMARY_STATEMENT(SUMMARY$summary_text)
# colnames(fortable, c(rep("", 10)))
SUMMARY_TABLE(SUMMARY$summary_table)
SUMMARY_TABLE_DF(SUMMARY$statement_table_dataframe)
incProgress(amount = 1)
PLOT_DETAILS("<i>The solid lines in the plot below is the median of the simulations and the shaded area show the 95% prediction interval.</i>")
STATUS_TRT_DUR_PLOT("<i>Up to date</i>. <br>")
print("end")
print(Sys.time())
return(PLOT_TRT_DUR)
}
)
SIM_df <- reactive({
validate(
need(!(input$TASK == 'onsize' & input$TASK == 'subgroups' & input$TASK == 'enrichment' & input$TASK == 'riskstrata'),
'Please choose a study design under Therapy Settings.')
)
TRT_DUR_reactive()
})
Plot_holder <- reactive({
validate(
need(!(input$TASK == 'onsize' & input$TASK == 'subgroups' & input$TASK == 'enrichment' & input$TASK == 'riskstrata'),
'Please choose a study design under Therapy Settings.')
)
plot_holder = ggplot()
})
#### text ####
SELECT_TASK_PROMPT <- reactive(
validate(
need(!(input$TASK == 'onsize' & input$TASK == 'subgroups' & input$TASK == 'enrichment' & input$TASK == 'riskstrata'),
'Please choose a study design under Therapy Settings.')
)
)
SUBGROUP_TEXT <- reactive(
if(is.null(input$TASK)) {
ALLGROUPS_TEST = ""
}else{
if(input$TASK == 'subgroups') {
ALLGROUPS_TEST = "<i> If a variable is missing, the simulation curve is for a population with a distribution of each group that was observed in the pooled data from the original studies.
For example, if baseline cavitary disease status is missing, approximately 60% (observed proportion in original studies) of the simulated population will have cavitary disease at baseline. Exact proportion will depend on other risk factors selected. See Summary of simulation specifications and results below for more details.</i>"
}else{
ALLGROUPS_TEST = ""
}
}
)
MISSINGDATA_TEXT <- reactive({
missing_cul = 0
if(input$CULM2_trt_dur_subgroups_available_quest == 1 & input$CULM2_trt_dur_subgroups == 100) {
missing_cul = 100
}
if(is.null(input$TASK)) {
TEXT = ""
}else{
if(input$TASK == 'subgroups' & sum(as.numeric(as.character(c(input$HIV_trt_dur_subgroups,
input$SMEAR_trt_dur_subgroups,
input$FEMALE_trt_dur_subgroups,
input$CAV_trt_dur_subgroups,
input$BMI_CAT_trt_dur_subgroups,
# input$AGE_CAT_trt_dur_subgroups,
missing_cul)))) > 100) {
TEXT = "<i>At least one variable is missing. Simulations may take a couple minutes.</i>"
}else{
TEXT = ""
}
}
}
)
ENRICH_TEXT <- reactive(
if(is.null(input$TASK)) {
TEXT = ""
}else{
if(input$TASK == 'enrichment') {
TEXT = "<i>If a variable is not enriched, then all groups for that variable are included in the simulation. The distribution of each group in the simulation will be the same distribution that was observed in the pooled data from the original studies.
For example, if sex is not enriched, approximately 70% (observed proportion in original studies) of the simulated population will be males. Exact proportion will depend on other risk factors selected. See Summary of simulation specifications and results below for more details.</i>"
}else{
TEXT = ""
}
}
)
RISKSTRATA_TEXT <- reactive(
if(is.null(input$TASK)) {
TEXT = ""
}else{
if(input$TASK == 'riskstrata') {
TEXT = "<i>To simplify simulations, the risk stratification simulation study plotted below will include males and females at a distribution observed in the pooled data from the original studies but will not stratify based on sex. Specifically, the population for each simulation curve will have approximately 70% (observed proportion in original studies) of males.
Additionally, only baseline factors will be included in the algorithm. For more simulations with other risk stratas not included in this panel, please select 'Perform simulations for a specific subgroup' under Therapy Settings.<br><br>
If a variable is not part of the risk stratification algorithm, then all groups for that variable are included in each simulation curve. The distribution of each group in the simulation will be the same distribution that was observed in the pooled data from the original studies.
For example, if HIV status is not part of the risk stratification algorithm, the population for each simulation curve will have approximately 14% (observed proportion in original studies) of patients co-infected with HIV. Exact proportion will depend on other risk factors selected.</i>"
}else{
TEXT = ""
}
}
)
# PLOT_SUBGROUP_ALLGROUPS_NOTE <- reactive(
#
#
# if(is.null(input$TASK)) {
# PLOT_NOTE_SUBGROUP = ""
# }else{
# if((input$TASK == 'subgroups' & input$CULM2_available_quest == "1" & input$CULM2_trt_dur_subgroups == 100) |
# (input$TASK == 'subgroups' & sum(as.numeric(as.character(c(input$HIV_trt_dur_subgroups,
# input$FEMALE_trt_dur_subgroups,
# input$BMI_CAT_trt_dur_subgroups,
# input$SMEAR_trt_dur_subgroups,
# input$CAV_trt_dur_subgroups)))) >= 100)) {
# PLOT_NOTE_SUBGROUP = "<i>'All groups' is selected for at least one variable.<br>
# If the variable is missing, do not use the variable for any plot settings. If you would like to compare groups in a single plot, please use the variable for one of the plot settings (e.g. color stratified or faceted plots).
# If 'All groups' is selected and the variable is missing or not used in Plot Settings, then each simulation curve represents a population with the distribution of each group that was observed in the pooled data from the original studies. <br>
# The faceted plot will partition the plots into a matrix of panels. Plots can be partitions for up to three separate variables (e.g. smear grade for color stratification, cavitation for x-axis facets, and HIV status for y-asix facets.</i>"
#
# } else{
# PLOT_NOTE_SUBGROUP = ""
#
# }
# }
#
# )
plotheight <- reactive({
if(is.null(input$TASK)){
plot_h =400
}else{
if(input$TASK == 'riskstrata' & input$BMI_CAT_trt_dur_riskstrata_quest == 1 & input$HIV_trt_dur_riskstrata_quest == 1){
plot_h = 1200
}else{
if(input$TASK == 'riskstrata' & input$BMI_CAT_trt_dur_riskstrata_quest == 1){
plot_h = 800
}else{
plot_h = 400
}
}
}
})
#### OUTPUTS ####
output$summary_table = DT::renderDataTable({
if(v$clearPlot) {
NULL
} else{
SUMMARY_TABLE()
}
})
output$sim_plot<-renderPlot({
if(v$clearPlot) {
Plot_holder()
} else{
withProgress(message = 'Updating plot', value = 0, {
SIM_df()
})
}
})
output$sim_plot.ui <- renderUI({
plotOutput("sim_plot", height = plotheight())
})
# status of calculate
output$trt_dur_plot_status = renderText({
STATUS_TRT_DUR_PLOT()
}
)
# status of calculate
output$trt_dur_summary = renderText({
if(v$clearPlot) {
""
} else{
SUMMARY_STATEMENT()
}
}
)
output$plot_details = renderText({
if(v$clearPlot) {
""
} else{
PLOT_DETAILS()
}
}
)
#make sure simulation selected
output$select_task_prompt = renderText({
SELECT_TASK_PROMPT()
})
output$select_task_prompt_2 = renderText({
SELECT_TASK_PROMPT()
})
output$subgroup_note = renderText({
SUBGROUP_TEXT()
})
output$enrich_note = renderText({
ENRICH_TEXT()
})
output$riskstrata_note = renderText({
RISKSTRATA_TEXT()
})
output$trt_dur_table_df = renderTable({
if(v$clearPlot) {
NULL
} else{
SUMMARY_TABLE_DF()
}
}
)
output$missing_data_subgroups = renderText({
MISSINGDATA_TEXT()
}
)
output$downloadData <- renderUI({
req(input$TASK, TRT_DUR_reactive())
if(v$clearPlot) {
""
} else{
downloadButton("downloadData01")
}
})
# output$downloadData01 <- downloadHandler(
# filename = function() {
# # paste(input$myquery, ".csv", sep = "")
# "test_shiny.html"
# },
#
#
# content =
# function(file)
# {
# rmarkdown::render(
# input = "report_file.Rmd",
# output_file = "built_report.html",
# params = list(table = SUMMARY_TABLE(),
# plot = TRT_DUR_reactive())
# )
# # print("here")
# readBin(con = "built_report.html",
# what = "raw",
# n = file.info("built_report.html")[, "size"]) %>%
# writeBin(con = file)
# # print("here1")
#
# }
# content = function(file) {
# # pdf(file)
# # write.csv(mydata(), file, row.names = FALSE)
# # ggplot()+
# # geom_line(aes(x = 1:10, y = 1:10))
# # output$sim_plot.ui
# # ggsave(file, plot = TRT_DUR_reactive(), device = "png")
# # pdf(file, width = 8.5, height = 11)
# pdf(file, width = 11, height = 8.5)
# sum_table = SUMMARY_TABLE_DF()
# mytheme <- gridExtra::ttheme_default(core = list(fg_params = list(hjust=0, x=0.05,
# fontsize=8)))
# g1 <- gridExtra::tableGrob(sum_table, theme = mytheme, rows=NULL)
#
# grid::grid.newpage()
# grid::grid.draw(g1)
# # print(TRT_DUR_reactive())
# dev.off()
# }
# )
# use withProgress for treatment duration to show in progress
###########################
#### Risk Scores and Optimal treatment duration ####
###########################
#If input parameters change then notify user that values need recalculation
STATUS_RISKSCORE <- reactiveVal()
observeEvent({list(
input$HIV_score,
input$SMEAR_score,
input$FEMALE_score,
input$CAV_score,
input$BMI_score,
# input$AGE_score,
# input$AFSITE_score,
input$model_score,
input$M2CUL_score,
input$target_cure_score,
# input$time_target_cure_score,
input$BMI_score_missing#,
# input$AGE_score_missing
)},
{
v$clear_score <- TRUE
STATUS_RISKSCORE("<B><font color='red'>Inputs changed, recalculation required.</font></B>")})
observeEvent(input$calc_risk_score, {
v$clear_score <- FALSE
}, priority = 10)
# calculation of risk score based on input parameters
RISKSCORE_reactive = eventReactive(input$calc_risk_score,{
STATUS_RISKSCORE("<i>Up to date</i>") # up to date message when calculate pressed
# print(here)
# input parameters
INPUTS_RISKSCORE = data.frame(
HIV = input$HIV_score,
SMEAR = input$SMEAR_score,
FEMALE = input$FEMALE_score,
CAV = input$CAV_score,
BMI = input$BMI_score,
# AGE = input$AGE_score,
AFSITE = 1,
TARGET_CURE = input$target_cure_score,
TIME_TARGET = 18
)
RAW_DATA = data %>%
mutate(ALL = 1) %>%
filter(EVID == 0)
if(input$model_score == "1004h"){
RISKSCORE_PAR = RISKSCORE_PAR_BASE_M2CUL
INPUTS_RISKSCORE = INPUTS_RISKSCORE %>%
mutate(CULM2 = input$M2CUL_score)
}
if(input$model_score == "1004i"){
RISKSCORE_PAR = RISKSCORE_PAR_BASE
INPUTS_RISKSCORE = INPUTS_RISKSCORE %>%
mutate(CULM2 = NA)
}
if(input$HIV_score != -99){
RAW_DATA = RAW_DATA %>% filter(HIV %in% input$HIV_score)
}
if(input$SMEAR_score != -99){
RAW_DATA = RAW_DATA %>% filter(SMEAR %in% input$SMEAR_score)
}
if(input$FEMALE_score != -99){
RAW_DATA = RAW_DATA %>% filter(FEMALE %in% input$FEMALE_score)
}
if(input$CAV_score != -99){
RAW_DATA = RAW_DATA %>% filter(CAV %in% input$CAV_score)
}
if(input$BMI_score_missing == 0 & input$BMI_score < 17){
RAW_DATA = RAW_DATA %>% filter(BMI < 17) %>%
mutate(BMI = input$BMI_score)
}
if(input$M2CUL_score != -99){
RAW_DATA = RAW_DATA %>% filter(CULM2 %in% input$M2CUL_score)
}
N_score = nrow(RAW_DATA)
# print(N_score)
if(any(as.numeric(as.character(c(input$HIV_score,
input$SMEAR_score,
input$FEMALE_score,
input$CAV_score,
input$BMI_score,
# input$AGE_score,
# input$AFSITE_score,
input$M2CUL_score))) ==-99, na.rm = T)){
MISSINGVARIABLES = data.frame(input$HIV_score,
input$SMEAR_score,
input$FEMALE_score,
input$CAV_score,
input$BMI_score,
# input$AGE_score,
# input$AFSITE_score,
input$M2CUL_score) %>%
t() %>%
data.frame %>%
rename(VALUE = 1) %>%
tibble::rownames_to_column("VARIABLE") %>%
filter(VALUE == -99)
RES_RISKSCORE = RAW_DATA %>%
sample_n(1000, replace = T) %>%
mutate(
TARGET_CURE = input$target_cure_score,
TIME_TARGET = 18) %>%
mutate(BASECULM2 = ifelse(is.na(CULM2), 1, ifelse(CULM2 == 1, 1+RISKSCORE_PAR$CULM2, 1)),
BASEFEMALE = ifelse(is.na(FEMALE), 1, ifelse(FEMALE == 0, 1+RISKSCORE_PAR$MALE, 1)),
BASEHIV = ifelse(is.na(HIV), 1, ifelse(HIV == 1, 1+ RISKSCORE_PAR$HIV, 1)),
BASESMEAR= ifelse(is.na(SMEAR),1+RISKSCORE_PAR$SMEAR3, ifelse(SMEAR ==2, 1+RISKSCORE_PAR$SMEAR2,
ifelse(SMEAR == 3, 1+RISKSCORE_PAR$SMEAR3,1))),
BASEBMI = ifelse(is.na(BMI), 1, 1+RISKSCORE_PAR$BMI*(18.37/5-BMI/5)),
BASECAV = ifelse(is.na(CAV), 1+RISKSCORE_PAR$CAV, ifelse(CAV == 1, 1+RISKSCORE_PAR$CAV, 1)),
BASESITE = ifelse(AFSITE ==0, 1+RISKSCORE_PAR$NONAFSITE, 1)) %>%
mutate(RISKSCOREVALUE = (BASECULM2*BASEFEMALE*BASEHIV*BASESMEAR*BASEBMI*BASECAV*BASESITE)) %>%
mutate(TIMEEFFECT = TIME_TARGET**RISKSCORE_PAR$SHAPE_BETA*(RISKSCORE_PAR$SHAPE_ALPHA*TIME_TARGET)**(-RISKSCORE_PAR$SHAPE_BETA)*(gamma(RISKSCORE_PAR$SHAPE_BETA+1) - Igamma(RISKSCORE_PAR$SHAPE_BETA+1, RISKSCORE_PAR$SHAPE_ALPHA*TIME_TARGET, lower = F))/RISKSCORE_PAR$SHAPE_ALPHA) %>%
mutate(TERM = RISKSCOREVALUE/10^4*TIMEEFFECT) %>%
mutate(OPTTRTDURTATION = (119- ((-log(TARGET_CURE)/TERM)-1)*28/RISKSCORE_PAR$EC5028)) %>%
# mutate(OPTTRTDURTATION = ifelse(OPTTRTDURTATION < 28 | OPTTRTDURTATION> 600, 28, OPTTRTDURTATION)) %>%
mutate(OPTTRTDURTATION = ifelse(OPTTRTDURTATION < 28, 28, OPTTRTDURTATION)) %>%
mutate(OPTTRTDURTATION = OPTTRTDURTATION/7) %>%
summarize(RISKSCOREVALUE = median(RISKSCOREVALUE),
OPTTRTDURTATION = median(OPTTRTDURTATION)) %>%
mutate(N_score = N_score)
}else {
#dataframe with input and risk score and optimal treatment duration information
RES_RISKSCORE = INPUTS_RISKSCORE %>%
mutate(BASECULM2 = ifelse(is.na(CULM2), 1, ifelse(CULM2 == 1, 1+RISKSCORE_PAR$CULM2, 1)),
BASEFEMALE = ifelse(FEMALE == 0, 1+RISKSCORE_PAR$MALE, 1),
BASEHIV = ifelse(HIV == 1, 1+ RISKSCORE_PAR$HIV, 1),
BASESMEAR= ifelse(SMEAR ==2, 1+RISKSCORE_PAR$SMEAR2,
ifelse(SMEAR == 3, 1+RISKSCORE_PAR$SMEAR3,1)),
BASEBMI = 1+RISKSCORE_PAR$BMI*(18.37/5-BMI/5),
BASECAV = ifelse(CAV == 1, 1+RISKSCORE_PAR$CAV, 1),
BASESITE = ifelse(AFSITE ==0, 1+RISKSCORE_PAR$NONAFSITE, 1)) %>%
mutate(RISKSCOREVALUE = (BASECULM2*BASEFEMALE*BASEHIV*BASESMEAR*BASEBMI*BASECAV*BASESITE)) %>%
mutate(TIMEEFFECT = TIME_TARGET**RISKSCORE_PAR$SHAPE_BETA*(RISKSCORE_PAR$SHAPE_ALPHA*TIME_TARGET)**(-RISKSCORE_PAR$SHAPE_BETA)*(gamma(RISKSCORE_PAR$SHAPE_BETA+1) - Igamma(RISKSCORE_PAR$SHAPE_BETA+1, RISKSCORE_PAR$SHAPE_ALPHA*TIME_TARGET, lower = F))/RISKSCORE_PAR$SHAPE_ALPHA) %>%
mutate(TERM = RISKSCOREVALUE/10^4*TIMEEFFECT) %>%
mutate(OPTTRTDURTATION = (119- ((-log(TARGET_CURE)/TERM)-1)*28/RISKSCORE_PAR$EC5028)) %>%
# mutate(OPTTRTDURTATION = ifelse(OPTTRTDURTATION < 28 | OPTTRTDURTATION> 600, 28, OPTTRTDURTATION)) %>%
mutate(OPTTRTDURTATION = ifelse(OPTTRTDURTATION < 28, 28, OPTTRTDURTATION)) %>%
mutate(OPTTRTDURTATION = OPTTRTDURTATION/7)%>%
mutate(N_score = N_score)
}
# print(RES_RISKSCORE)
})
#### OUTPUTS ####
# risk score info box
output$riskscore = renderInfoBox({
if(v$clear_score) {
# infoBox(title = "", value = HTML("<i><span style='font-weight: normal;'>Please recalculate score.</i></span>"),
infoBox(title = "", value = HTML(""),
color = "aqua", icon = icon("calculator"))
} else{
RISK_SCORE_df = RISKSCORE_reactive()
optimal_dur = ceiling(RISK_SCORE_df$OPTTRTDURTATION)
if(optimal_dur <= 18){
color_info = "green"
riskgroup = "Low risk group"
}
if(optimal_dur > 18 & optimal_dur <=24){
color_info = "aqua"
riskgroup = "Moderate risk group"
}
if(optimal_dur > 24){
color_info = "red"
riskgroup = "High risk group"
}
# STRING_RISKSCORE = paste(riskgroup, paste(paste("(risk score = ", format(round(RISK_SCORE_df$RISKSCOREVALUE, 2), nsmall = 2), sep =""), ")", sep =""))
STRING_RISKSCORE =riskgroup
infoBox(title = "", value = STRING_RISKSCORE, color = color_info, icon = icon("calculator"))
}
}
)
# risk score info box
output$opt_trt_duration_res = renderInfoBox({
if(v$clear_score) {
# infoBox(title = "", value = HTML("<i><span style='font-weight: normal;'>Please recalculate score.</i></span>"),
infoBox(title = "", value = HTML(""),
color = "aqua", icon = icon("calculator"))
} else{
RISK_SCORE_df = RISKSCORE_reactive()
optimal_dur = ceiling(RISK_SCORE_df$OPTTRTDURTATION)
STRING_TRT_DURAT = paste("*Optimal treatment duration = ", paste(optimal_dur, "weeks"), sep ="")
if(optimal_dur <= 18){
color_info = "green"
}
if(optimal_dur > 18 & optimal_dur <=24){
color_info = "aqua"
}
if(optimal_dur > 24){
color_info = "red"
}
infoBox(title = "", value = STRING_TRT_DURAT, color =color_info , icon = icon("calculator"))
}
}
)
# risk score info box
output$N_original = renderInfoBox({
if(v$clear_score) {
# infoBox(title = "", value = HTML("<i><span style='font-weight: normal;'>Please recalculate score.</i></span>"),
infoBox(title = "", value = HTML(""),
color = "aqua", icon = icon("users"))
} else{
RISK_SCORE_df = RISKSCORE_reactive()
# print(RISK_SCORE_df)
STRING_N = paste("*N =", round(RISK_SCORE_df$N_score))
infoBox(title = "", value = STRING_N, color = "aqua", icon = icon("users"))
}
}
)
# status of calculate
output$riskscore_status = renderText({
STATUS_RISKSCORE()
}
)
#
output$footnote_riskscore = renderText({
if(v$clear_score) {
""
} else{
# "<i><br>*N is the number of patients with selected risk factors in the modified-intent-to-treat population from the pooled original studies. If a patient characteristic is missing, number of patients is based on available patient characteristics and all groups of missing variable(s).<br>
# **Optimal treatment duration for daily (7/7 doses per week) regimen with standard dose rifampin, isoniazid, pyrazinamide, and ethambutol or a fluoroquinolone. </i>"
"<i><br>*Optimal treatment duration for daily (7/7 days per week) regimen with standard dose rifampin, isoniazid, pyrazinamide, and ethambutol or a fluoroquinolone. </i>"
}
}
)
###########################
}